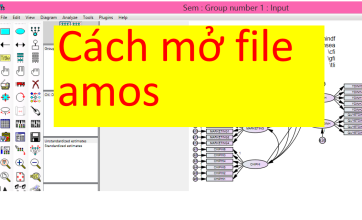
Cách hiển thị macro để hiển thị ra các chỉ số model fit trong AMOS, thay vì phải xem các chỉ số model fit ở trong phần kết quả, ta có thể xem ngay trên giao diện. Th.s Khánh và nhóm giới thiệu đến các bạn cách hiển thị macro để hiển thị ra các chỉ số model fit trong AMOS nhé
Mục đích sử dụng text macro hiển thị kết quả gì
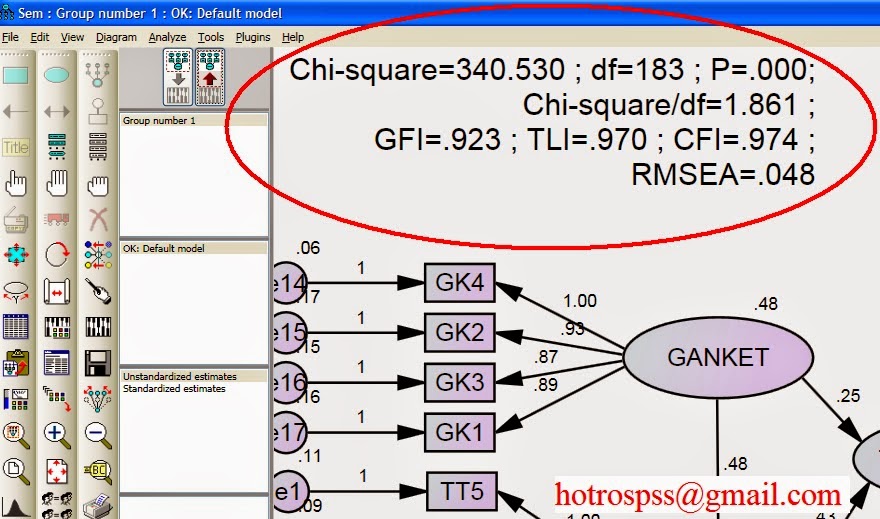
Thay vì phải xem các chỉ số model fit ở trong phần kết quả, bạn có thể xem ngay trên giao diện bằng cách gõ chỉ số cơ bản ví dụ như sau:
Chi-square=\cmin ; df=\df ; P=\p;
Chi-square/df=\cmindf ;
GFI=\gfi ; TLI=\tli ; CFI=\cfi ;
RMSEA=\rmsea
- Cách này rất hiệu quả trong khi hiệu chỉnh mô hình, tăng cường model fit, vì mỗi lần ta thực hiện chạy lại mô hình AMOS thì chỉ cần nhìn trực tiếp lên màn hình sẽ thấy được các kết quả.
- Tiết kiệm thời gian: Tự động hóa việc ghi chú kết quả, không cần copy-paste thủ công.
- Đảm bảo tính chính xác: Tránh lỗi đánh máy khi sao chép số liệu.
- Tính nhất quán: Giúp trình bày kết quả đồng bộ trong các báo cáo hoặc luận văn.
- Dễ dàng cập nhật: Khi mô hình thay đổi và chạy lại, các giá trị sẽ tự động được cập nhật.
- Macro trong AMOS được biểu thị , ví dụ như “Chi-square=\cmin”, đây là kết quả sẽ được thay bằng số khi chạy ra kết quả, và kết quả sẽ là “Chi-square=340.530” trong ví dụ ở bài này.
Cách thực hiện sử dụng text macro
1. Chọn vào biểu tượng Figure Captions, hoặc vào menu Diagram-> Figure Captions

2. Vẽ Figure Captions trên màn hình amos, gõ nội dung sau vào:
Chi-square=\cmin ; df=\df ; P=\p;
Chi-square/df=\cmindf ;
GFI=\gfi ; TLI=\tli ; CFI=\cfi ;
RMSEA=\rmsea

3. Thực hiện chạy lại AMOS bằng cách nhấn vào nút Calculate Estimates
4. Nhìn lại kết quả, sẽ như hình vẽ.
Các macro thông dụng trong AMOS
\cmin : hiển thị giá trị Chi bình phương Chi-square
\df : hiển thị số bậc tự do, cái này nhóm hotrospss@gmail.com sẽ có một bài nói về làm sao tính được df bằng tay, để các bạn hiểu rõ được bản chất của nó
\p : p-value
\cmindf : tỉ số Chi-square/df, cái này rất quan trọng để ước lượng độ phù hợp của mô hình
\gfi : chỉ số GFI Goodness of Fix Index
\tli : chỉ số Tucker–Lewis index
\cfi : chỉ số CFI Comparative Fix Index.
\rmsea :chỉ số RMSEA Root Mean Square Errors of Approximation
Xử lý sự cố macro không hiển thị giá trị
Nếu macro không hiển thị giá trị: mô hình chưa được chạy hoặc chưa được chạy lại sau khi thay đổi, lỗi cú pháp macro. Lúc đó mô hình thường lỗi XX:default model như bên dưới nhé

Mặc dù AMOS có nhiều macro, nhưng không phải mọi tham số đều có macro riêng để hiển thị trực tiếp trên sơ đồ. Một số kết quả chi tiết hơn vẫn cần phải xem trong cửa sổ “Text Output” của AMOS.
Tất cả macro
Còn sau đây là tất cả các text macro trong AMOS, các bạn nghiên cứu sâu có thể tham khảo thêm:
\cmin is a “text macro”, a code that Amos fills in with the minimum value of the discrepancy function
\agfi Adjusted goodness of fit index (AGFI)
\aic Akaike information criterion (AIC)
\bcc Browne-Cudeck criterion (BCC)
\bic Bayes information criterion (BIC)
\caic Consistent AIC (CAIC)
\cfi Comparative fit index (CFI)
\cmin Minimum value of the discrepancy function C in Appendix B
\cmindf Minimum value of the discrepancy function divided by degrees of freedom
\datafilename The name of the data file. \longdatafilename displays the fully qualified path name of the data file.
\datatablename The name of the data table (for those file formats that allow a single file to contain multiple data tables, such as Excel workbooks.)
\date Today’s date in short format. \longdate displays today’s date in long format. The displayed date is made current whenever the path diagram is read from a file, saved or printed.
\df Degrees of freedom
\ecvi Expected cross-validation index (ECVI)
\ecvihi Upper bound of 90% confidence interval on ECVI
\ecvilo Lower bound of 90% confidence interval on ECVI
\f0 Estimated population discrepancy (F0)
\f0hi Upper bound of 90% confidence interval on F0
\f0lo Lower bound of 90% confidence interval on F0
\filename Name of the current AMW file. Use \longfilename to display the complete path to the current AMW file.
\fmin Minimum value of discrepancy function F in Appendix B
\format Format name
\gfi Goodness of fit index (GFI)
\group Group name
\hfive Hoelter’s critical N for =.05
\hone Hoelter’s critical N for =.01
\ifi Incremental fit index (IFI)
\longdatafilenameThe fully qualified path name of the data file. \datafilename displays the data file name without the path.
\longdate Today’s date in long format. \date display’s today’s date in short format. The displayed date is made current whenever the path diagram is read from a file, saved or printed.
\longfilename Fully qualified path name of the current AMW file. Use \filename to display the file name without the path.
\longtime The time in long format. \time displays the time in short format. The displayed time is made current whenever the path diagram is read from a file, saved or printed.
\mecvi Modified ECVI (MECVI)
\model Model name
\ncp Estimate of non-centrality parameter (NCP)
\ncphi Upper bound of 90% confidence interval on NCP
\ncplo Lower bound of 90% confidence interval on NCP
\nfi Normed fit index (NFI)
\npar Number of distinct parameters
\p “p value” associated with discrepancy function (test of perfect fit)
\pcfi Parsimonious comparative fit index (PCFI)
\pclose “p value” for testing the null hypothesis of close fit (RMSEA < .05)
\pgfi Parsimonious goodness of fit index (PGFI)
\pnfi Parsimonious normed fit index (PNFI)
\pratio Parsimony ratio
\rfi Relative fit index
\rmr Root mean square residual
\rmsea Root mean square error of approximation (RMSEA)
\rmseahi Upper bound of 90% confidence interval on RMSEA
\rmsealo Lower bound of 90% confidence interval on RMSEA
\time The time in short format. \longtime displays the time in long format. The displayed time is made current whenever the path diagram is read from a file, saved or printed.
\tli Tucker-Lewis index (TLI)
Xem thêm:
- Cách sử dụng text macro hiển thị kết quả trong AMOS
- Mức độ phù hợp mô hình Model Fit và các chỉ số đo độ phù hợp mô hình trong phân tích AMOS
- Cách tạo bảng khảo sát trực tuyến bằng Google Forms
- Hướng dẫn thực hành phân tích hồi quy nhị phân binary logistic
- Mô hình và thang đo bài Các yếu tố ảnh hưởng đến sự gắn kết của cán bộ, công chức tại Chi cục Hải quan Cửa khẩu Cảng Sài Gòn


